Google Sheets Budget Template: Free Download + Complete Tutorial
 Ever get to the end of the month, look at your bank balance, and have absolutely no idea where the money went? You've probably tried a budgeting app or two — they always seem fine for a week, then you stop opening them. Sound familiar?
Honestly, the thing that finally stuck for me was a plain old Google Sheets budget template. It's free, it's flexible, and the data lives in your Google Drive instead of on some startup's server that may or may not exist next year. Nobody's mining your transaction history for ad targeting.
In this guide I'll walk you through building a Google Sheets budget that actually gets used — the columns I'd put in, the formulas that do the boring math, and a few small habits that make the difference between "I tracked spending for two weeks" and "I've been doing this for years."
Why Google Sheets, Honestly?
 WalletMap mobile monthly ledger with recurring income and expense rows
Look, there are dozens of budgeting apps. So why bother with a spreadsheet?
A few reasons that keep coming up:
It's actually free. No "free for the first month" then $80/year. You can build as many sheets as you want, forever.
The data is yours. Your salary, your bank balance, your investment positions — they sit in your own Google Drive. That's a different feeling from handing them to a budgeting startup that might pivot, get acquired, or shut down next year.
You can shape it however you want. A spreadsheet is a blank canvas. Want a column just for your daily coffee habit? Add it. Need to track a side hustle? Drop in another sheet. Apps lock you into someone else's mental model. Sheets don't.
It syncs everywhere. Type in an expense on your phone, see it on your laptop ten seconds later. No app to install, no account migration, nothing.
The formulas do the math. SUM, SUMIF — that's about all you need. Your totals update the moment you add a row.
What Should the Template Have?

Don't overthink it. A solid setup has roughly four worksheets:
1. Monthly Expenses Sheet
The foundation of your budget — a daily log of every purchase:
- Date — When you spent the money
- Category — Type of expense (Food, Transport, Entertainment, Shopping, Health, etc.)
- Description — What you bought (e.g., "Grocery shopping" or "Gas")
- Amount — How much it cost
- Payment Method — Cash, credit card, mobile payment, etc.
2. Income Tracker Sheet
A record of all money coming in:
- Date — When you received the income
- Source — Where it came from (Salary, freelance work, investment returns, bonus, etc.)
- Amount — How much
- Notes — Any relevant details
3. Assets Overview Sheet
A monthly snapshot of your net worth—where all your money is:
- Asset Type — Savings account, fixed deposit, stocks, crypto, real estate, etc.
- Account/Holding Name — Specific account or investment name
- Amount — How much you have
- Currency — USD, TWD, EUR, etc.
4. Investment Portfolio Sheet
If you invest in stocks, ETFs, or crypto, track them here:
- Asset Name — Full name of the stock, fund, or coin
- Ticker Symbol — Stock symbol or ticker
- Purchase Price — What you paid per unit
- Quantity — How many units you own
- Current Price — Today's price
- Gain/Loss — Automatically calculated profit or loss
- Percentage Return — ROI as a percentage
Setting Up Your Template Step-by-Step
Step 1: Create a New Spreadsheet
- Go to Google Sheets (sheets.google.com)
- Click "Create" → "Blank spreadsheet"
- Rename it something memorable, like "My 2026 Budget"
Step 2: Build Your Monthly Expenses Sheet
In Sheet1, set up your expense tracker with these columns:
| Date | Category | Description | Amount | Payment Method |
|---|---|---|---|---|
| 2026-03-01 | Food | Breakfast | 8 | Cash |
| 2026-03-01 | Transport | Bus pass | 5 | Card |
| 2026-03-02 | Shopping | New shirt | 45 | Credit Card |
Quick tip: Highlight the header row. Select row 1, click "Fill color," and pick a light shade. It makes the table much easier to read.
Step 3: Add Auto-Calculating Totals
Below your expense entries, add this formula to calculate total spending:
Total Expenses: =SUM(D2:D100)
This automatically adds up all amounts in column D. As soon as you add a new expense, the total updates instantly.
Step 4: Create Category Summaries
In an empty area of your sheet, create quick category breakdowns:
Food Total: =SUMIF(B:B,"Food",D:D)
Transport Total: =SUMIF(B:B,"Transport",D:D)
Shopping Total: =SUMIF(B:B,"Shopping",D:D)
Entertainment Total: =SUMIF(B:B,"Entertainment",D:D)
Each formula totals up that category for you. This is usually where the "wait, I spent how much on takeout this month?" moment lives.
Step 5: Add More Sheets
Click the "+" button at the bottom to create additional sheets:
- Income — Record salary, freelance earnings, investment returns
- Assets — Your net worth breakdown (updated monthly)
- Investments — Stock and crypto holdings (if applicable)
Step 6: Build a Dashboard Sheet
Create a new sheet called "Dashboard" to see your financial snapshot at a glance:
Monthly Income: =SUM('Income'!D:D)
Monthly Expenses: =SUM('Expenses'!D:D)
Monthly Surplus: =SUM('Income'!D:D)-SUM('Expenses'!D:D)
Total Assets: =SUM('Assets'!B:B)
Savings Rate: =(SUM('Income'!D:D)-SUM('Expenses'!D:D))/SUM('Income'!D:D)
Now opening the file dumps the headline numbers in your face — much harder to ignore than digging through tabs.
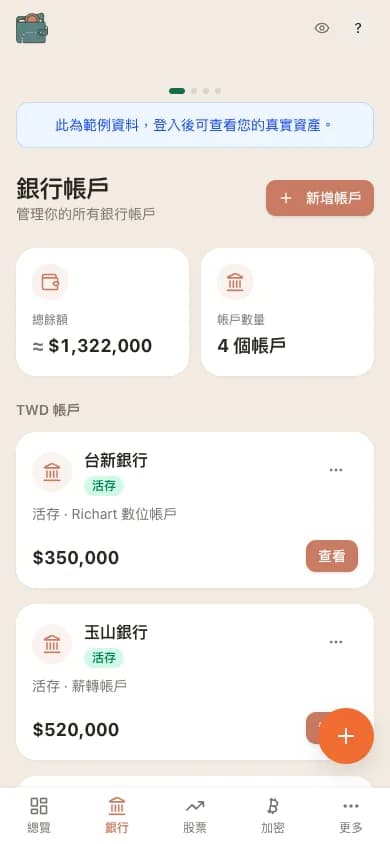 WalletMap mobile bank account overview
Small Things That Make a Big Difference
A few extras that pay off if you stick around:
Dropdown menus stop typo chaos. Select your Category column, hit Data → Data validation, and feed it a fixed list. Otherwise you'll end up with "Food", "food ", and "Foof" all eating into your SUMIF totals.
Charts make you actually look. Select your expenses, Insert → Chart, and let it draw a pie or a bar chart. Reading numbers in a column is one thing — seeing entertainment quietly take up a third of your spending is another.
Split by month if you're in for the long haul. Sheets named "2026-03", "2026-04", and so on, with the dashboard pulling summaries from each. Year-end reviews suddenly become possible instead of being a six-hour archaeology project.
Where Manual Tracking Starts to Hurt
Google Sheets is great until life gets a bit more complicated. A few things tend to break the habit:
You miss a few days. Then you guess. Then the data isn't really data anymore.
If you hold any stocks or crypto, prices move daily, and updating them by hand gets old fast. Stocks are tedious; crypto is basically impossible to keep current manually.
Multi-currency makes it worse. USD checking, EUR savings, a bit of crypto — exchange rates shift constantly and converting everything back to your home currency by hand wastes a lot of evenings.
And your data is scattered. Bank app here, brokerage there, exchange somewhere else. You built this nice spreadsheet system, but really you've turned yourself into the system's manual data feeder.
WalletMap: Keep the Spreadsheet, Drop the Busywork
This is roughly why WalletMap exists. The idea is simple: your numbers stay in your own Google Sheets — we just take care of the updating and the visualisation parts.
In practice that means:
- Stock and crypto prices update on their own — you set things up once, then stop manually refreshing prices
- Currencies get converted automatically — accounts in USD, EUR, JPY, crypto, all rolled into your base currency at current rates
- Dashboards out of the box — net worth, asset allocation, trends, without writing five formulas
- We don't store your balances — the actual money figures live in your Drive, our database doesn't keep them
Basically: you keep the privacy and flexibility of Sheets, you just stop doing the boring data entry.
Putting It All Together
- Create a blank spreadsheet — Start with a new Google Sheets document
- Design your structure — Set up sheets for expenses, income, assets, and investments
- Add formulas — Use SUM and SUMIF to calculate totals automatically
- Build a dashboard — Create one view showing your key numbers
- Make it pretty — Add colors, charts, and formatting so it's easy to use
- Log your spending — Commit to updating it regularly (daily or weekly)
- Recognize when manual tracking gets hard — Consider automation when managing multi-currency, frequent updates, or complex portfolios
A Few Closing Thoughts
A Google Sheets budget is one of the cheapest, most honest ways to start understanding your money. It's free, it's yours, and you bend it to your life — not the other way around. Spend an hour or two getting the columns right and you'll have a system that actually fits how you think.
The catch is that as your finances pick up complexity — multiple currencies, a growing portfolio, frequent trades — keeping the sheet up to date becomes its own job. At some point you're maintaining the tracker more than you're using it.
That's where something like WalletMap takes over. You keep your Sheets. You keep your privacy. You just hand the repetitive parts off so you can spend the time actually thinking about your money instead of typing numbers into cells.
Either way, the move that matters is starting. Open the spreadsheet, set up the columns, and just begin — and on whatever day the price-and-FX updates start feeling like a second job, that's a fine moment to let something like WalletMap take that part off your hands.