Track Expenses Without Linking Your Bank: 3 Alternatives Compared
 You've probably been there. You download an expense tracker, and the first thing it asks for is your bank login. Some people are fine with that — automatic sync is genuinely convenient. Others get a small lurch in their stomach at the idea of handing account access to a third party.
Whichever camp you're in, the good news is you don't actually need to link a bank to track your finances well. Here are three approaches that skip the bank connection entirely, with the actual trade-offs of each.
Why Some People Prefer Not to Link Their Bank
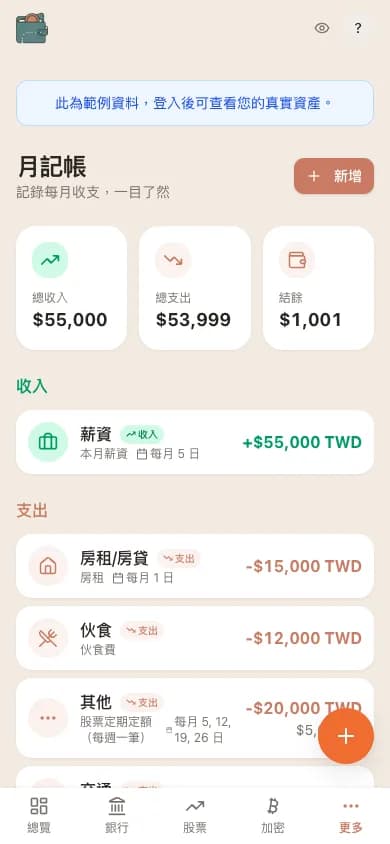 WalletMap mobile monthly ledger — no bank linking required
Automatic bank sync is genuinely convenient — it saves manual entry and logs transactions for you. Major apps like Moneybook in Taiwan have invested in security certifications, and large platforms like Plaid follow real encryption standards. So none of this is about pretending those tools are unsafe.
But the hesitation some people have is reasonable too. A few specific things come up.
First, there's another copy of your data. Your transaction history ends up sitting on the app company's servers in addition to your bank's — one more place where it exists. Second, there's the intermediary layer: some apps use third-party services like Plaid or Yodlee to talk to your bank, which adds more parties to the chain. Third, it's just a question of control — some people prefer to know exactly where their financial data lives and who can see it.
None of those are unreasonable. Here are three approaches that don't require linking your bank.
Method 1: Manual Google Sheets

The setup is what it sounds like — you build your own spreadsheet, list account balances, investment positions, and expense categories, and update it manually whenever things change.
The upside is total control. The data lives only in your Google Drive, and you can organize it however you want. It's free, there's no app to install, no permissions to grant.
The downside is the manual upkeep. Regular input takes time, errors and omissions happen, stock prices and exchange rates need to be looked up by hand, and meaningful visualizations are hard to build from scratch.
If your financial picture is fairly simple and you don't mind a few minutes of upkeep now and then, a well-organized spreadsheet really can be enough.
Method 2: Receipt Scanning Apps
The pitch here is to photograph receipts or scan invoices, and the app handles the rest — detecting amounts, merchants, and categories automatically. In Taiwan, apps like CWMoney, MOZE, and Ahorro all support electronic invoice scanning with carrier codes.
The wins are concrete. Almost no manual entry — snap a photo or scan and you're done. No bank linking. AI handles the categorization. Taiwan's electronic invoice system makes the whole flow especially smooth.
The catches: spending records still live on the app's servers, the focus is firmly on expenses rather than investment portfolios or multi-currency assets, some advanced features sit behind paid plans, and OCR isn't always 100% accurate — you'll occasionally need to fix a misread.
If your main goal is "how much did I spend and where," this is a good balance between efficiency and not handing over your bank login.
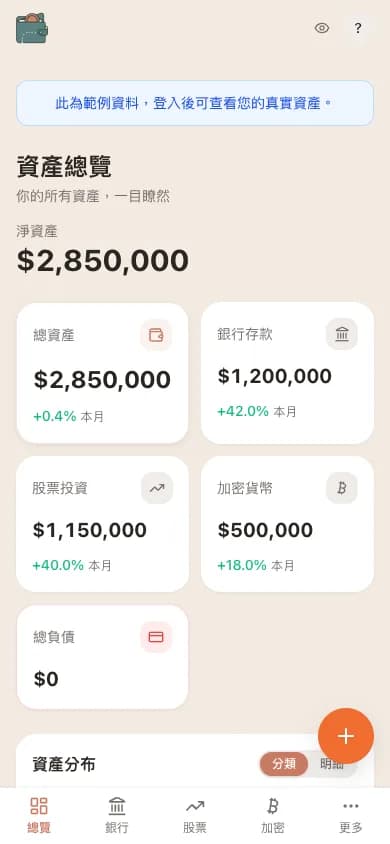 WalletMap mobile dashboard overall summary
Method 3: Google Sheets + WalletMap
The idea here is to keep your asset records in Google Sheets — bank balances, stocks, crypto holdings — and connect WalletMap to your Sheets for automatic price updates and visual dashboards.
The flow looks roughly like this:
- You list your holdings in Google Sheets (e.g., 100 shares of TSMC, $5,000 cash, 0.5 BTC)
- WalletMap connects to your Sheets with read-only access
- WalletMap automatically fetches stock prices, exchange rates, and crypto prices
- Your dashboard shows updated net worth, allocation charts, and a currency breakdown
- All financial data stays in your Google Drive — WalletMap's backend doesn't store it
Upsides: data stays in your own Google Drive, prices and FX update automatically without manual lookups, supports local stocks, US stocks, crypto, and multi-currency, and you get a unified dashboard for the whole picture. It's free.
Downsides worth flagging: the initial setup involves listing all your holdings in Sheets, and you need to update Sheets manually whenever you buy or sell. Web-only for now, no native mobile app. No invoice scanning, so it's not built for daily small expenses. You'll need a Google account.
This works best if you have an investment portfolio and want to see your overall net worth in one place. If your main need is logging daily spending, the receipt scanning route is probably a better fit.
Side-by-Side Comparison
| Manual Sheets | Receipt Scanning Apps | Sheets + WalletMap | |
|---|---|---|---|
| Data location | Your Google Drive | App servers | Your Google Drive |
| Automation | Low | Medium (photo/scan) | Medium (auto price updates) |
| Daily expense tracking | Possible but tedious | Very convenient | Not its strength |
| Investment tracking | Possible but manual price lookup | Not designed for this | Convenient |
| Multi-currency | Manual conversion | Most don't support | 12 currencies, auto-convert |
| Cost | Free | Free to paid | Free |
| Bank linking | Not required | Not required | Not required |
Pick What Fits Your Life
You don't need bank linking to manage your finances well. Each of these approaches lands in a different spot.
Simple financial picture? Manual Sheets is genuinely fine. Mostly tracking daily spending? Receipt scanning apps are convenient and quick. Diversified investments and want a unified asset view? Sheets + WalletMap automates price updates and pulls everything into one dashboard.
You can also mix and match — receipt scanning for daily expenses, WalletMap for investments. They solve different problems and don't conflict.
The real point is finding a method you'll actually stick with. Whatever you pick, if it helps you understand your financial situation clearly, it's the right one.
For full disclosure, Method 3 is basically what WalletMap does — your data lives in your own Google Drive and the backend doesn't store any of the sensitive financial details. If you fall into the "no bank linking, but I do have investments to keep an eye on" camp, it's worth a look.